Motivation
I had the chance to watch some loom talks. In these videos I saw people run millions of them but I thought that -as always- there is no silver bullet. So what is the catch? How are they different from Kernel Threads and could we visualize this difference?
In their published material the team that works on loom have mentioned that fibers are not intended for all kinds of processing. For example Ron Presler does mention the difference between a long living thread that is decoding a video and a typical short lived thread serving web applications. In the first case we have a long running highly computational task that has to appear to run on it’s own. On the other hand a typical web server application does some little cpu work, block/wahit on some service e.g. database, rest API call, the do something else, block/wait and so on. Fibers are designed to cater to this typical server application.
My understanding
I imagined this focus on the server workload should have implication on how a task is run between the two mechanisms. Or put it another way if we managed to look into the JVM then we would be able to see tasks run with Kernel threads to stop and resume many more times than tasks that run with fibers. I had formed this hypothesis but I wasn’t 100% sure so I was wrestling with how to come up with a way to verify it.
The observation challenge
When we are trying to look at what happens to data by threads inside a jvm we are governed -or most appropriately for this case, constrained- by the rules of synchronization. By ‘looking’ in this context I mean reading data written by other threads in our effort to observe their behavior. If we don’t look in a thread-safe way it is very possible that we are looking at garbage. But if we add the proper synchronization constructs then we are changing how the the very thing we are trying to observe operates. In effect we are skewing our observation.
I can remember Heinz Kabutz trying to explain this concept to me during my participation to his Java Master course. I have to admit at the time I did not fully comprehend it yet it did leave a mark with me.
First thought – capturing time
So if we cannot use synchronization constructs to look at what is happening then what can we do. My first thought was that maybe I could use the notion of time. Somehow to record the time when a thread is running. This is how we tend to reason about when things are happening in the ‘real’ world. If we want to record when trains are passing, when we see them we check our clocks and write down the time. With that information then we can then reason about when trains have run in our recorded data window.
If I could get the times when a task is running and record them I could then also reason about when a thread has been executing. I quickly dismissed this idea though because when going down to the thread execution due to the speed that everything is happening it would require an incredibly precise time measuring tool. The best we have in java is System.nanoTime but it is clearly documented in the JavaDoc it is not designed to act as a time source and it cannot be depended on it’s resolution.
Using a AtomicInteger as a “time” source
Thinking a bit more about it I realized what I needed from my “time” source was to be monotonic and be able to guarantee that no two tasks could observe the same value or a value out of order. An incrementing AtomicInteger is providing these properties.
The experiment idea
So I needed some tasks to run concurrently and record their execution using the increasing AtomicInteger. So I came up with the following mental model to reason about the problem. Since ‘loom’ takes us back to an agrarian setting I was also inspired to use another agrarian theme, that of farming!
So we have a number of fields that we need to plant seeds to them. We plant them at equal length so these have a specific number of spots. The seeds are taken from a single source one at a time and are numbered in the order that they are taken. Each thread/task is tasked to plant one field using seeds taken from the source. Once all fields have been planted we can look at what seed numbers have been put into each field.
The hypothesis
While a task is actually running we will be expecting to see closely consecutive seed numbers. Respectively if a task is not running, for example if it is not scheduled or has been preemptively suspended, we then expect to see a gap in the seed number and the other task(s) to take the seed numbers in the gap.
So executing our experiment with kernel threads we expect to see tasks to start earlier and see far more gaps in seed number and interleaving of seed numbers with other tasks. On the other hand with fibers we would expect to have more contiguous blocks of seed numbers in each field and expect to see tasks to start later after others have finished.
Implementation details
Before showing you the visual result, please let me talk about a couple of the implementation details
Startup latch
I have found that the creation of threads can take a long time thus minimizing the chances that they will run “at the same time” so I have used a CountDownLatch as a gate to increase the parallelism of the experiment. I grappled with whether to include this and whether this would skew my experiment artificially towards more parallelism. In the end I decided to keep it since I am also including it when running with fibers so after the gate opens it is the same conditions for both runs.
End latch – Observation safety
I have also used a latch to mark the completion of all the seedings. This serves two functions. One obvious one and one less obvious. The first is to “signal” the main thread that it can now proceed and display the results. The other one is related to the observation challenge I mentioned earlier in the post. With the latch we can make the “observation” or reading of the results thread safe. Since we are only interested in the end result and each task is executing .countDown() and the main thread continues by calling await() and there is a happens-before relationship between the to calls or as JavaDoc puts it: calling countDown() happen-before actions following a successful return from a corresponding await() in another thread.
Result
So here is the visual result from the experiment execution! 🙂
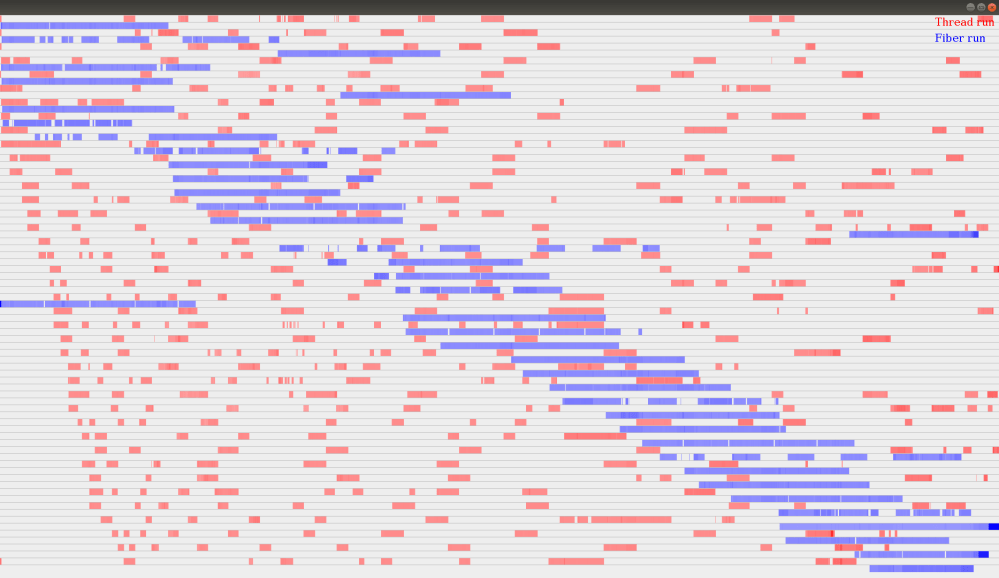
With red we can see the Kernel Thread execution results and with blue the Fiber execution. Each horizontal lane represents a Field/Task. If you imagine a vertical line at each pixel this represents a range of seed numbers. So effectively we can see which seed numbers a Task was able to get and seed to its field. Since the number of seeds is much larger(~20mil for this example) to represent how many seed number a task got in a range the color gradient is changed. The lighter the color the fewer it got and the darker the more. White represents it got no seed numbers in the range.
Result interpretation
In this example we can see that once a fiber starts it continues to conclusion with minimum to none scheduling interruptions. We can also see the Fiber implementation will not start new tasks unless others have finished and start time for each task is progressively later.
On the other hand we can see that tasks running with Kernel Threads are starting more closely together and their execution is more interleaved.
In effect we can visually see how the system scheduler is attempting to interleave computation to increase the level -or illusion- of multitasking. While with Fibers we can clearly see that they are indeed minimizing the number of context switches and achieving longer runs of continuous computation.
Conclusion
I have to say that I am very excited about Loom & Fibers. They do provide another concurrency options for java and JVM and they will clearly improve the performance of many workloads. Especially server applications with a lot of blocking code and consequently with performance and scalability issues will see great benefits.
However code execution with Fibers is not the same as Kernel Threads but simply faster -as I hope I have been able to demonstrate with my post-. As is true with most tools an understanding of it’s pros and cons and fundamental principles is necessary to apply this to the right workloads and cases to get the most benefit from its use.
Code
You can find the code for this experiment and visualization on my github:
https://github.com/gaganis/loom-visualizer
Relevant Links
- Ron Pressler presentation
https://www.youtube.com/watch?v=fpyub8fbrVE
- JCP proposal
http://cr.openjdk.java.net/~rpressler/loom/Loom-Proposal.html - Openjdk wiki
https://wiki.openjdk.java.net/display/loom/Main
